San Diego Real Estate Blog

San Diego Real Estate Blog - Real Estate News and Information in San Diego County California - Blog about Real Estate in San Diego County California


Sept. 17, 2025

Santee Real Estate Market Update Fall 2025

Santee Real Estate Market Update Fall 2025

Opportunities for Buyers and Sellers in the Santee Market

As we progress through 2025, the Santee housing market (ZIP code 92071) in East County San Diego, continues to show a dynamic blend of resilience and market rebalancing. The latest data from the Greater San Diego Association of REALTORS® offers valuable insights into both detached and attached homes (single-family and condo/townhomes), comparing current metrics with the same period in 2024. Here's what buyers, sellers, and investors need to know.
Santee Real Estate 2025 Fall San Diego California


🔑 Key Highlights (Through August 2025)

📌 Detached Homes (Single-Family)

Metric 2024 2025 % Change
New Listings 268 335 +25.0%
Pending Sales 228 237 +3.9%
Closed Sales 216 214 -0.9%
Median Sales Price $850,000 $855,000 +0.6%
% of List Price Received 101.4% 100.1% -1.3%
Days on Market 19 27 +42.1%

📈 Analysis:

  • The detached home market is seeing more inventory enter the market, with a 25% rise in new listings. This indicates growing seller confidence.

  • However, despite increased supply, closed sales dipped slightly (-0.9%), suggesting buyers are taking longer to make decisions or being more selective.

  • Homes are sitting on the market longer (up to 27 days) — a sign that the red-hot pace of recent years is moderating.

  • Prices remain stable, with a small increase in median sales price (+0.6%), reinforcing the market’s overall strength.


📌 Attached Homes (Condos & Townhomes)

Metric 2024 2025 % Change
New Listings 215 204 -5.1%
Pending Sales 155 118 -23.9%
Closed Sales 141 114 -19.1%
Median Sales Price $605,000 $600,000 -0.8%
% of List Price Received 100.3% 98.5% -1.8%
Days on Market 23 41 +78.3%

📉 Analysis:

  • The attached market is slowing, with new listings and sales volume both trending downward.

  • Days on market surged nearly 80%, reflecting waning urgency among buyers and potentially softer demand in this segment.

  • Prices dipped slightly (-0.8%), showing that buyers may be gaining more negotiating power.

  • This part of the market may offer better buying opportunities in late 2025 for entry-level buyers or investors.


📊 Inventory & Supply Trends

Metric 2024 2025 % Change
Detached – Inventory 36 43 +19.4%
Detached – Months Supply 1.4 1.6 +14.3%
Attached – Inventory 46 56 +21.7%
Attached – Months Supply 2.8 3.6 +28.6%

📌 Analysis:

  • Inventory growth is evident in both detached and attached markets, a sign that balance is slowly returning.

  • Months of supply remain below 4 months, which still technically reflects a seller-favored market, though the direction is clearly shifting toward neutral.


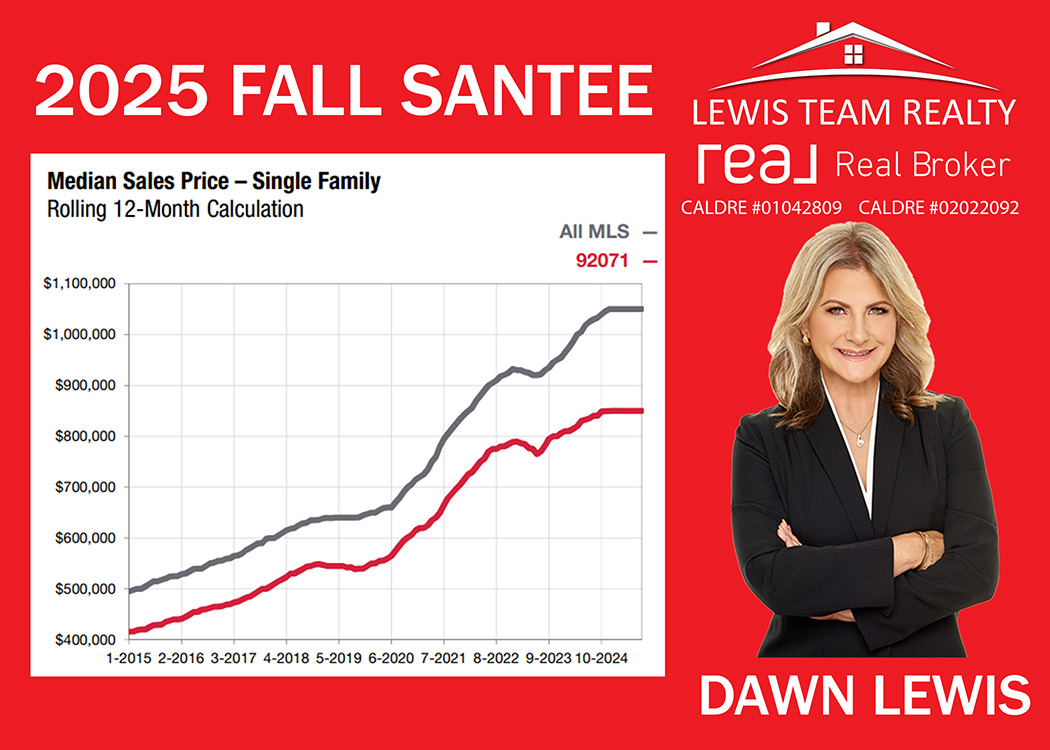
🏠 Historical Price Trends (2015–2024)

The report includes rolling 12-month median price trends, showing the dramatic climb in home values since 2015:

  • Detached homes rose from the low $400,000s in 2015 to over $850,000 in 2024.

  • Condos/townhomes grew from the low $300,000s to around $600,000 over the same period.

Even with the 2025 cooling, Santee has experienced strong long-term appreciation.


💡 What This Means for Buyers and Sellers

🔍 For Buyers:

  • More inventory and longer DOM (days on market) mean more choices and less competition.

  • Slight price softening in condos could present an opportunity, especially for first-time buyers.

  • Be strategic — homes are still selling close to list price.

💼 For Sellers:

  • The market remains resilient, especially for detached homes.

  • Proper pricing and presentation are critical, as homes are not moving as fast as last year.

  • Consider selling sooner rather than later if you want to maximize returns before further softening.


📍 Final Thoughts

The Santee housing market in 2025 is showing signs of normalization after years of breakneck growth. Detached homes remain in high demand, while attached homes are seeing a bit of a pause. The market is neither crashing nor overheated — it's stabilizing.

Whether you're looking to buy, sell, or invest, staying informed with local market data like this ensures smarter decisions. And in a shifting market like Santee’s, being proactive — not reactive — is the key to real estate success.

San Diego Real Estate

Sept. 16, 2025

Imperial Beach Real Estate Declines Sharply - Fall 2025 Update

Imperial Beach Real Estate Declines Sharply - Fall 2025 Update

2025 Year to Date Median Prices Drop Significantly for Detached and Attached Homes

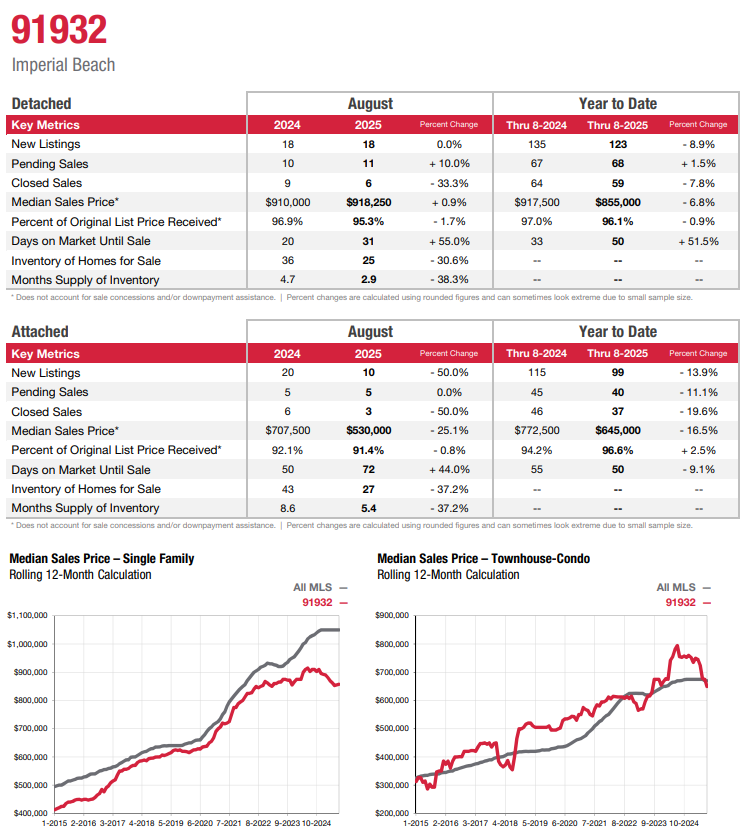
Imperial Beach, located in South Bay San Diego, closed August with fewer sales, leaner inventory, and longer market times—yet pricing held better for single-family homes than for condos. Here’s a clear, local snapshot you can use to plan your next move.

Imperial Beach CA Real Estate Statistics Fall 2025 Homes Condos

Detached (Single-Family Homes in Imperial Beach)

  • New Listings: 18 → 18 (flat)
  • Pending Sales: 10 → 11 (+10.0%)

  • Closed Sales: 9 → 6 (–33.3%)

  • Median Sales Price: $918,250 (+0.9%)

  • % of Original List Price Received: 95.3% (–1.7 pts)

  • Days on Market (DOM): 31 (+55.0%)

  • Active Inventory: 25 (–30.6%)

  • Months’ Supply: 2.9 (–38.3%)

Attached (Townhomes and Condos in Imperial Beach)

  • New Listings: 10 (–50.0%)

  • Pending Sales: 5 (flat)

  • Closed Sales: 3 (–50.0%)

  • Median Sales Price: $530,000 (–25.1%)

  • % of Original List Price Received: 91.4% (–0.8 pts)

  • Days on Market (DOM): 72 (+44.0%)

  • Active Inventory: 27 (–37.2%)

  • Months’ Supply: 5.4 (–37.2%)

Year-to-Date Through August

Detached (YTD 2025 vs. YTD 2024)

  • New Listings: 123 (–8.9%)

  • Pending Sales: 68 (+1.5%)

  • Closed Sales: 59 (–7.8%)

  • Median Sales Price: $855,000 (–6.8%)

  • % of Original List Price Received: 96.1% (–0.9 pts)

  • DOM: 50 (+51.5%)

Attached (YTD 2025 vs. YTD 2024)

  • New Listings: 99 (–13.9%)

  • Pending Sales: 40 (–11.1%)

  • Closed Sales: 37 (–19.6%)

  • Median Sales Price: $645,000 (–16.5%)

  • % of Original List Price Received: 96.6% (+2.5 pts)

  • DOM: 50 (–9.1%)


Imperial Beach Real Estate Stats for Fall 2025

What the Numbers Mean for Imperial Beach

1) Inventory is lean—especially for single-family homes

Detached inventory dropped 30.6% year over year and months’ supply slid to 2.9, a clear seller-tilted level. Even with slower closings and longer market times, the scarcity of listings helped hold prices nearly flat in August (+0.9%). Sellers who price near the market are still getting ~95% of original list on average. Buyers should expect competition on well-priced houses and may need to move decisively.

2) Condos softened more than houses

Attached homes saw a sharper price reset—–25.1% in August and –16.5% YTD—alongside much slower absorption (DOM 72 in August). Fewer new listings (–50%) and a lower months’ supply (5.4) suggest some stabilization potential ahead, but buyers currently hold more leverage in this segment than in detached.

3) Demand is selective, not absent

Detached pending sales ticked up in August (+10%), even as closings fell, reflecting deals stacking into September/October. In short: buyers are still writing offers, but they’re patient and value-sensitive. Expect longer negotiations and conditional timelines, especially on properties that overreach on price or need work.

4) Longer time on market requires sharper strategy

DOM rose materially for detached (to 31 in August; 50 YTD). For sellers, week-one pricing, turnkey presentation, and strong marketing matter more this year. For buyers, the extra time can create room for inspection credits or rate-buydown concessions—particularly on listings with longer market exposure.


Guidance for Sellers

  • Price within the window. Detached homes are still clearing near 95%–97% of original list when aligned to comps; overpricing invites longer DOM and bigger reductions.

  • Win the first weekend. With lean inventory, many buyers are “on alert.” Launch with full photo/video, tight copy, and broad online exposure to capture them early.

  • Mind the micro-segment. Attached values have moved more than detached—lean on the freshest, nearest comps (last 30–60 days) and adjust for condition precisely.

  • Use incentives surgically. If showings stall after 2–3 weeks, consider a modest price correction plus a targeted credit (e.g., closing costs or rate buydown) rather than large sequential cuts.

  • Prepare for appraisals. With shifting comps, equip your agent with a packet (updates, permits, features list) to support value.

Guidance for Buyers

  • Detached: be ready. Low months’ supply (2.9) means desirable single-family homes still move. Have underwriting and funds verified to compete.

  • Attached: negotiate details. With DOM higher and prices off, you may secure seller credits for rate buydowns, repairs, or HOA-related concerns—especially on listings >30 days.

  • Focus on total payment. Pair price with today’s rate environment; closing credits that reduce your monthly cost can beat small list-price cuts.

  • Watch coming pendings. August’s pending activity hints at comps arriving soon—use them to sharpen offers or valuation during contingency periods.


Bottom Line

  • Detached (SFR): Tight supply, slower closings, but relatively resilient prices. Sellers who price to the market still succeed; buyers must be decisive on quality homes.

  • Attached (Condo/Townhome): More negotiable with deeper price adjustments and higher DOM—good opportunity for buyers to secure credits and value.

Source: Greater San Diego Association of REALTORS® Local Market Update for Imperial Beach 91932, current as of September 5, 2025; data from San Diego MLS. 

San Diego Real Estate

Note: Median prices and list-to-sold ratios do not reflect concessions or down-payment assistance; small sample sizes can magnify percentage swings.

Sept. 13, 2025

Oceanside South Real Estate Market Update Fall 2025

Oceanside South Real Estate Market Update Fall 2025

Buyer Urgency Cools Off but Prices Still Inch Up

Current as of September 5, 2025. Data: Greater San Diego Association of REALTORS® Local Market Update (San Diego MLS).92054 Oceanside South in North County Coastal San Diego


Fast Take

  • Detached (single-family homes in Oceanside 92054): Prices inched up year over year for August, even as buyer urgency cooled (pendings down, DOM higher). Inventory fell and months’ supply tightened to ~2.4, keeping leverage tilted toward well-prepared sellers.

  • Attached (townhome/condoin Oceanside 92054): Mixed signals—more new listings and pendings in August, but closings slowed and prices were softer month-over-month and notably lower YTD. Months’ supply held around ~4.2, a near-balanced/buyer-leaning setup. 

Note: Median prices and % of list received exclude concessions. Small sample sizes in 92054 can make % changes look extreme.

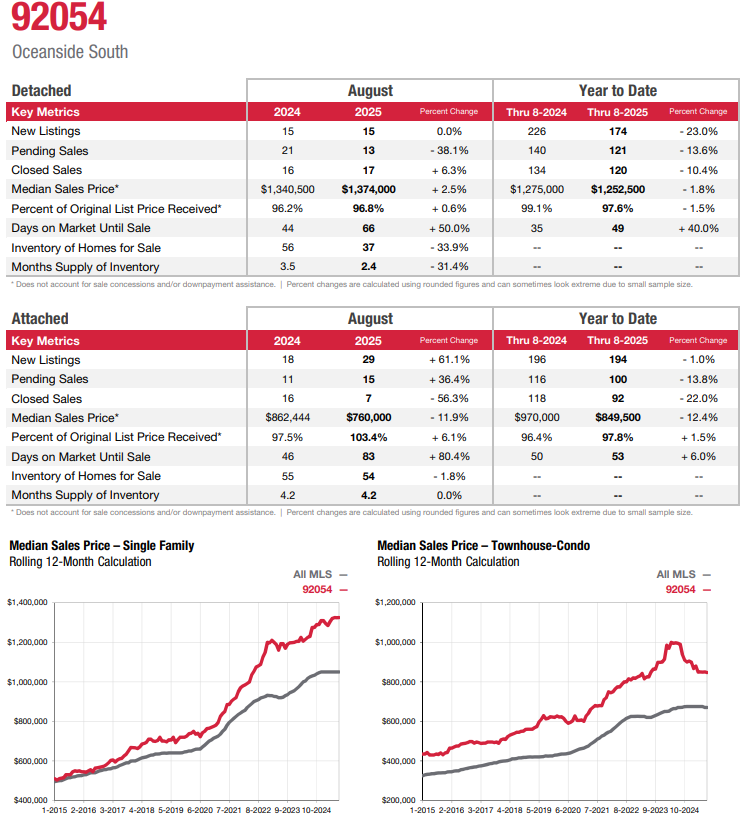
Oceanside Real Estate Statistics Fall 2025 Attached and Detached Homes


Detached Homes (Single-Family)

August 2025 vs. August 2024

  • New Listings: 15 → 15 (0.0%)

  • Pending Sales: 21 → 13 (-38.1%)

  • Closed Sales: 16 → 17 (+6.3%)

  • Median Sales Price: $1,340,500 → $1,374,000 (+2.5%)

  • % of Original List Price Received: 96.2% → 96.8% (+0.6%)

  • Days on Market (median): 44 → 66 (+50.0%)

  • Active Inventory: 56 → 37 (-33.9%)

  • Months’ Supply: 3.5 → 2.4 (-31.4%).

Read on this: Despite slower buyer action (fewer pendings, longer DOM), tight supply and a slight price gain suggest the best-presented homes still command attention. Sellers have leverage, but it’s conditional on pricing and condition.

Year-to-Date (through August)

  • New Listings: 226 → 174 (-23.0%)

  • Pending Sales: 140 → 121 (-13.6%)

  • Closed Sales: 134 → 120 (-10.4%)

  • Median Sales Price: $1,275,000 → $1,252,500 (-1.8%)

  • % of Original List Price Received: 99.1% → 97.6% (-1.5%)

  • Days on Market (median): 35 → 49 (+40.0%).

What it means for SFR: The YTD story is fewer listings, slower absorption, and slightly lower pricing—classic normalization from the pandemic run-up. Expect more days on market and tighter appraisal/inspection negotiations than last year.


Oceanside 92054 Real Estate Statistics Fall 2025 Attached and Detached Homes

Attached Homes (Townhomes & Condos)

August 2025 vs. August 2024

  • New Listings: 18 → 29 (+61.1%)

  • Pending Sales: 11 → 15 (+36.4%)

  • Closed Sales: 16 → 7 (-56.3%)

  • Median Sales Price: $862,444 → $760,000 (-11.9%)

  • % of Original List Price Received: 97.5% → 103.4% (+6.1%)

  • Days on Market (median): 46 → 83 (+80.4%)

  • Active Inventory: 55 → 54 (-1.8%)

  • Months’ Supply: 4.2 → 4.2 (flat).

Read on this: August brought more options and more accepted offers, but many of those will close later, so closings lagged. Pricing softened on the month, though the % of list >100% hints that the best-located or turnkey units can still see competition.

Year-to-Date (through August)

  • New Listings: 196 → 194 (-1.0%)

  • Pending Sales: 116 → 100 (-13.8%)

  • Closed Sales: 118 → 92 (-22.0%)

  • Median Sales Price: $970,000 → $849,500 (-12.4%)

  • % of Original List Price Received: 96.4% → 97.8% (+1.5%)

  • Days on Market (median): 50 → 53 (+6.0%).

What it means for condos/THs: The YTD picture is demand down and prices retracing from 2024 highs. With ~4.2 months of supply and longer DOM, buyers have time and leverage; sellers succeed by pricing to the market and offering value (condition, credits, or rate buydowns).


Strategy Playbook

If You’re Selling You're Home in Oceanside

  • Price to today’s comps. Over-ask outcomes are rarer; accepted offers cluster near list—sometimes below—after inspections. Build in negotiation room.

  • Win on presentation. With DOM up across both segments (to 66 days for SFR and 83 days for attached in August), turnkey condition (paint, flooring, lighting, landscaping) can be the difference between watching and selling.

  • Use concessions strategically. Consider closing-cost credits or rate buydowns—especially for attached listings near the balanced range (~4.2 months).

If You’re Buying a Home in Oceanside

  • Detached: Inventory is thinner (months’ supply ~2.4), so clean, well-priced homes can still draw multiple offers. Leverage longer DOM to negotiate timing, repairs, or small credits—but move decisively on quality.

  • Attached: Take advantage of more choice, more time, and softer YTD pricing. Compare HOA dues/amenities/reserves and request rate buydowns or seller credits to improve total monthly cost.


Longer-Term Context

Rolling 12-month charts in the report show the multi-year rise in both segments through 2021–2023, followed by 2024–2025 normalization: slower absorption, fewer over-ask outcomes, and greater sensitivity to price and condition—especially in the attached market. Use that lens when setting expectations for pricing and timeline this fall.


Methodology & Notes

Figures reflect August 2025 results versus August 2024, and Year-to-Date (through August) versus the same 2024 period. Medians and % of original list price exclude concessions; small counts can amplify percent swings. Source: San Diego MLS; Local Market Update for 92054 – Oceanside South; © 2025 ShowingTime Plus, LLC.

San Diego Real Estate

Sept. 12, 2025

Rancho Peñasquitos Real Estate Market Update Fall 2025

Rancho Peñasquitos Real Estate Market Update Fall 2025

Detached Homes in Rancho Penasquitos New Listings, Pending Sales, Closed Sales, Median Sales Price All Down Year to Date

Current as of September 5, 2025. Data: Greater San Diego Association of REALTORS® Local Market Update (San Diego MLS).


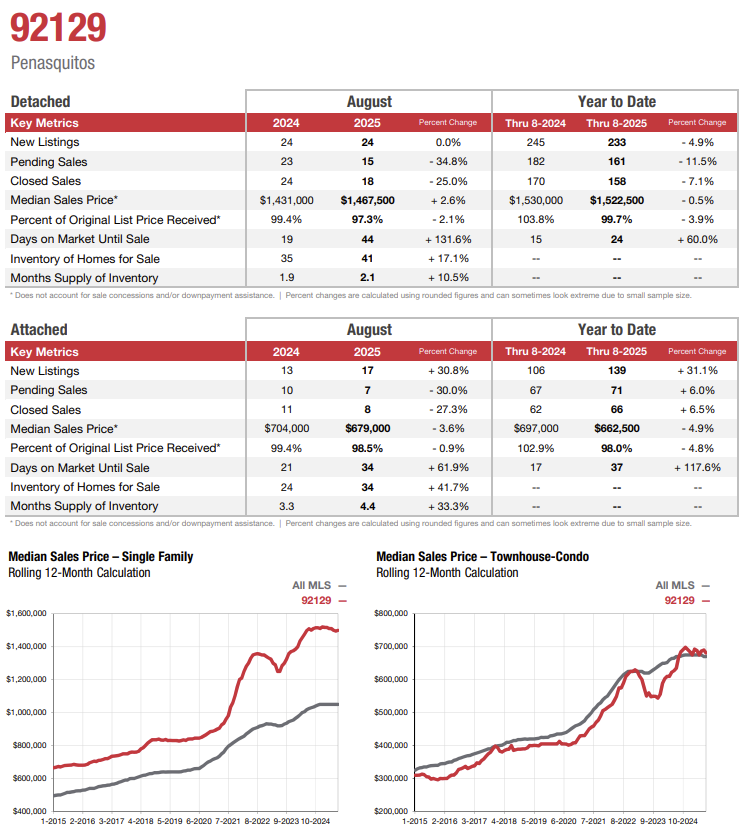
Rancho Penasquitos Real Estate Statistics Fall 2025 Attached and Detached Homes

Quick Takeaways

  • Detached homes in Rancho Penasquitos (single-family): Prices are essentially holding year-over-year while demand cooled and marketing times doubled. Inventory edged up, but supply remains lean at just ~2.1 months, so quality listings still move when priced correctly.

  • Attached homes in Rancho Penasquitos (townhome/condo): More choices, slower pace, softer pricing. Inventory and months’ supply climbed sharply to ~4.4 months, and days on market lengthened, giving buyers room to negotiate. This is similar to most areas in North County Inland San Diego.

Note: Median prices and % of list received do not account for concessions and/or down-payment assistance. Percent changes use rounded figures.


Detached Homes (Single-Family)

August 2025 vs. August 2024

  • New Listings: 24 → 24 (0.0%)

  • Pending Sales: 23 → 15 (-34.8%)

  • Closed Sales: 24 → 18 (-25.0%)

  • Median Sales Price: $1,431,000 → $1,467,500 (+2.6%)

  • % of Original List Price Received: 99.4% → 97.3% (-2.1%)

  • Days on Market (median): 19 → 44 (+131.6%)

  • Active Inventory: 35 → 41 (+17.1%)

  • Months’ Supply: 1.9 → 2.1 (+10.5%).

What it means: Pricing remains resilient even as buyer urgency eased (pendings/closings down, DOM up). With supply still just a little over two months, clean, well-priced homes continue to attract offers—just not at the frenzied pace of prior years.

Year-to-Date (through August)

  • New Listings: 245 → 233 (-4.9%)

  • Pending Sales: 182 → 161 (-11.5%)

  • Closed Sales: 170 → 158 (-7.1%)

  • Median Sales Price: $1,530,000 → $1,522,500 (-0.5%)

  • % of Original List Price Received: 103.8% → 99.7% (-3.9%)

  • Days on Market (median): 15 → 24 (+60.0%).

Read on this: Over-ask bidding has normalized (99.7% of original list YTD vs 103.8% last year). Sellers should expect more days on market and build in room for minor credits or appraisal/inspection negotiations.


Attached Homes (Townhomes & Condos)

August 2025 vs. August 2024

  • New Listings: 13 → 17 (+30.8%)

  • Pending Sales: 10 → 7 (-30.0%)

  • Closed Sales: 11 → 8 (-27.3%)

  • Median Sales Price: $704,000 → $679,000 (-3.6%)

  • % of Original List Price Received: 99.4% → 98.5% (-0.9%)

  • Days on Market (median): 21 → 34 (+61.9%)

  • Active Inventory: 24 → 34 (+41.7%)

  • Months’ Supply: 3.3 → 4.4 (+33.3%).

What it means: Buyers now have significantly more selection and time. With months’ supply near the balanced range and DOM stretching, attached-segment pricing is more negotiable than a year ago.

Year-to-Date (through August)

  • New Listings: 106 → 139 (+31.1%)

  • Pending Sales: 67 → 71 (+6.0%)

  • Closed Sales: 62 → 66 (+6.5%)

  • Median Sales Price: $697,000 → $662,500 (-4.9%)

  • % of Original List Price Received: 102.9% → 98.0% (-4.8%)

  • Days on Market (median): 17 → 37 (+117.6%).

Read on this: Even with more closings YTD in Rancho Penasquitos, extra supply has pulled prices back and widened negotiation bands. Expect attached sellers to offer credits, rate buydowns, or list-price adjustments to compete.


Rancho Penasquitos Real Estate Statistics Fall 2025 Homes and Condos

How to Use These Trends

For Sellers

  • Price to today’s comps in Rancho Penasquitos, not last spring’s headlines. Over-ask outcomes have faded; most accepted offers land near—but often below—list after inspections.

  • Invest in presentation. With DOM up across both segments, homes that feel turnkey (paint, flooring, lighting, landscaping) still command the strongest traffic and best terms.

  • Plan for negotiation. Build in contingencies for credit requests or minor repairs, especially in the attached segment with ~4.4 months of supply.

For Buyers

  • Detached: Still competitive for the best houses, but the tempo is calmer. Use longer DOM and slightly higher inventory to negotiate repairs, credits, or timing.

  • Attached: Conditions are buyer-tilted in Rancho Penasquitos. With more choices and longer DOM, ask for rate buydowns, closing-cost credits, or price improvements—and take the time to compare HOA dues, amenities, and reserves.


Longer-Term Context

Rolling 12-month charts in the report show the multi-year climb in 92129 values since 2015, followed by today’s post-pandemic normalization: slower absorption, more inventory, and fewer over-ask outcomes. Use that lens when setting expectations for both price and timing in late 2025.


Methodology & Notes

  • Figures reflect August 2025 monthly results and Year-to-Date through August comparisons vs. the same periods in 2024.

  • Medians and “% of original list received” exclude concessions; percent changes use rounded figures and can look large when sample sizes are small.

  • Source: San Diego MLS; Local Market Update prepared for GSDAR; © 2025 ShowingTime Plus, LLC.

San Diego Real Estate

Sept. 11, 2025

Clairemont Real Estate Market Update 92117 Fall 2025

Clairemont Real Estate Market Update 92117 Fall 2025

Market Conditions in Clairemont San Diego CA

Current as of September 5, 2025. Data source: San Diego MLS.

Snapshot: Detached Homes (Single-Family)

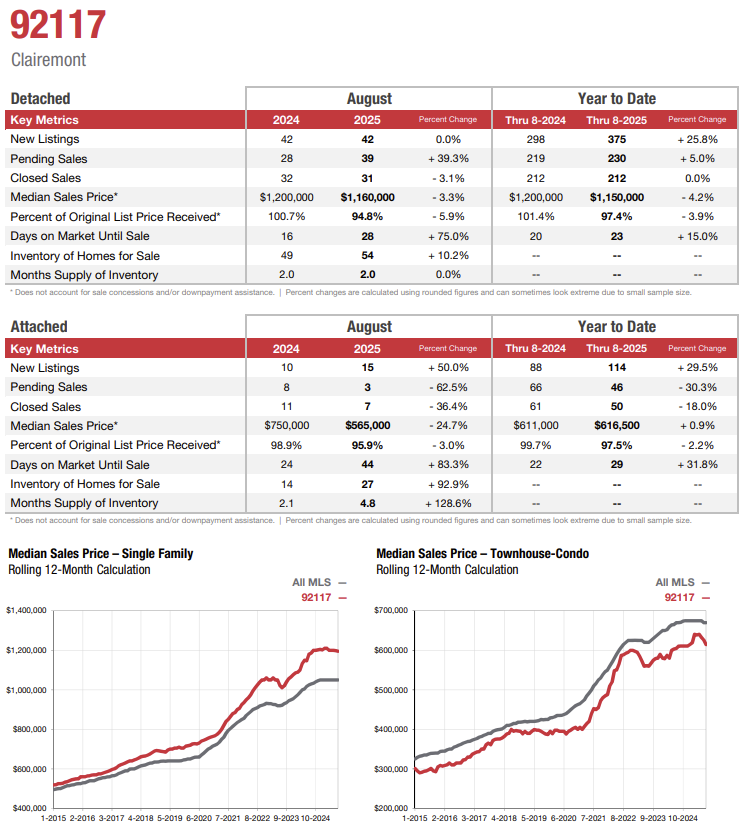
August vs. last August in Clairemont 92117 San Diego CA

  • New Listings: 42 → 42 (0.0%)

  • Pending Sales: 28 → 39 (+39.3%)

  • Closed Sales: 32 → 31 (-3.1%)

  • Median Sales Price: $1,200,000 → $1,160,000 (-3.3%)

  • % of Original List Price Received: 100.7% → 94.8% (-5.9%)

  • Days on Market (median): 16 → 28 (+75.0%)

  • Active Inventory: 49 → 54 (+10.2%)

  • Months’ Supply: 2.0 → 2.0 (flat).

Year-to-Date (through Aug) in Clairemont 92117 San Diego CA

  • New Listings: 298 → 375 (+25.8%)

  • Pending Sales: 219 → 230 (+5.0%)

  • Closed Sales: 212 → 212 (flat)

  • Median Sales Price: $1,200,000 → $1,150,000 (-4.2%)

  • % of Original List Price Received: 101.4% → 97.4% (-3.9%)

  • Days on Market (median): 20 → 23 (+15.0%).

Detached takeaways

  • Demand hasn’t disappeared—pendings jumped in August—but buyers are price-sensitive.

  • Pricing eased ~3–4% both monthly and YTD, and DOM lengthened, signaling the need for sharper pricing and condition.

  • Despite more listings YTD, supply remains ~2 months, still a seller-leaning environment—but no longer “anything sells at any price.”


Clairemont Real Estate Update in San Diego California 92117 Zip Code 2025 Fall

Snapshot: Attached Homes (Townhomes & Condos)

August vs. last August in Clairemont 92117 San Diego CA

  • New Listings: 10 → 15 (+50.0%)

  • Pending Sales: 8 → 3 (-62.5%)

  • Closed Sales: 11 → 7 (-36.4%)

  • Median Sales Price: $750,000 → $565,000 (-24.7%)

  • % of Original List Price Received: 98.9% → 95.9% (-3.0%)

  • Days on Market (median): 24 → 44 (+83.3%)

  • Active Inventory: 14 → 27 (+92.9%)

  • Months’ Supply: 2.1 → 4.8 (+128.6%).

Year-to-Date (through Aug) in Clairemont 92117 San Diego CA

  • New Listings: 88 → 114 (+29.5%)

  • Pending Sales: 66 → 46 (-30.3%)

  • Closed Sales: 61 → 50 (-18.0%)

  • Median Sales Price: $611,000 → $616,500 (+0.9%)

  • % of Original List Price Received: 99.7% → 97.5% (-2.2%)

  • Days on Market (median): 22 → 29 (+31.8%).

Attached takeaways

  • August showed a notable cooldown: slower pendings and a sharp monthly price drop, as inventory nearly doubled and months’ supply rose to ~4.8—favoring buyers.

  • YTD pricing is still slightly up (~+0.9%), which suggests August’s dip may reflect mix (smaller units trading) and negotiating room, not a full-year reset.


Price Trends Over the Long View

Rolling 12-month visuals (in the report) show the broad arc since 2015 in Clairemont 92117 for both single-family and townhome/condo segments. Pair that context with 2025’s higher inventory, longer DOM, and lower list-to-sale ratios to understand why accurate pricing and turnkey presentation are paramount right now. 


What This Means for Sellers

Detached sellers (SFR)

  • Expect more showings before offers: DOM rose from 16 to 28 in August; buyers are selective.

  • Price to the market, not above it: the % of original list price received fell to 94.8% in August; overpricing can cost you both time and net.

  • Preparation matters: with more YTD listings on the market (+25.8%), homes that look “move-in ready” earn stronger activity.

Attached sellers (TH/condo)

  • It’s a buyer-tilted micro-market right now: months’ supply ~4.8, DOM up, and pendings down.

  • If selling this fall, plan for strategic price positioning, concessions, or light improvements to stand out.


What This Means for Buyers

Detached buyers

  • You have more leverage than last year: list-to-sale ratios have eased and inventory ticked up.

  • Still move decisively on quality homes: months’ supply is ~2.0, so clean, well-priced SFRs draw competition.

Attached buyers

  • Conditions favor you: more choices, more time, and more room to negotiate. Use the current 4.8 months’ supply to secure inspections, credits, or price improvements.


Bottom Line for Clairemont (92117)

  • SFRs: Balanced-leaning-seller market with softening prices and longer marketing times—successful sales hinge on precise pricing and presentation.

  • Condos/Townhomes: Buyer-friendly at the moment; August’s pullback contrasts with an essentially flat/slightly positive YTD price trend—opportunity for value-driven purchases.

  • Strategy: Whether buying or selling, align price with recent comps, account for DOM trends, and anticipate negotiation on credits and timing.

Source: Greater San Diego Association of REALTORS® — Local Market Update for August 2025, Clairemont 92117. Current as of Sept 5, 2025.

Clairemont Real Estate San Diego 2025

Sept. 10, 2025

East Chula Vista Real Estate Market Fall 2025

East Chula Vista Real Estate Market Fall 2025

Including EastLake & Otay Ranch 91913, 91914, 91915

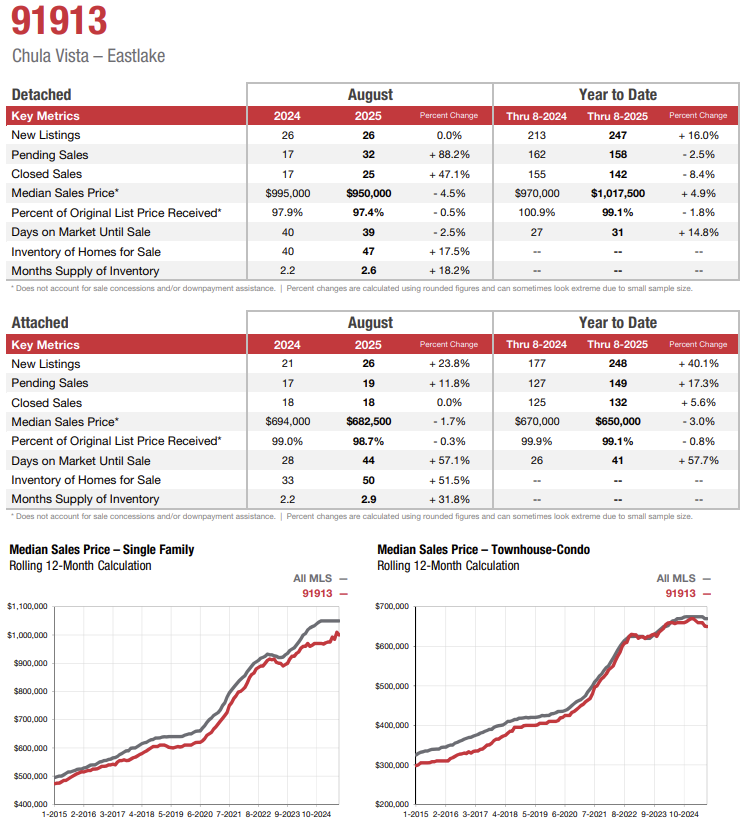
Below is a clear, data-driven read on what actually happened in August 2025 and year-to-date (through August) across EastLake and adjacent Otay Ranch Rolling Hills Ranch. All figures come straight from the San Diego MLS monthly update.


East Chula Vista Real Estate Market Report Fall 2025

91913 — Chula Vista (EastLake)

Single-Family (Detached)

August 2025 vs. August 2024

  • New listings: 26 → 26 (flat)

  • Pending sales: 17 → 32 (+88.2%)

  • Closed sales: 17 → 25 (+47.1%)

  • Median sales price: $995,000 → $950,000 (–4.5%)

  • % of original list received: 97.9% → 97.4% (–0.5 pp)

  • Days on market (DOM): 40 → 39 (slightly faster)

  • Active inventory: 40 → 47 (+17.5%)

  • Months’ supply: 2.2 → 2.6 (+18.2%)

Year-to-Date (Jan–Aug)

  • New listings: 213 → 247 (+16.0%)

  • Pendings: 162 → 158 (–2.5%)

  • Closings: 155 → 142 (–8.4%)

  • Median price: $970,000 → $1,017,500 (+4.9%)

  • % of original list received: 100.9% → 99.1% (–1.8 pp)

  • DOM: 27 → 31 (+14.8%; slower)

August popped in activity (pendings/closings) as sellers added modestly more inventory and buyers jumped on opportunities—likely helped by negotiability (down from 100.9% YTD last year to 99.1% this year) and slightly longer DOM. YTD prices are still up ~5% even with August’s month-over-month dip.

Townhome/Condo (Attached)

August 2025 vs. August 2024

  • New listings: 21 → 26 (+23.8%)

  • Pendings: 17 → 19 (+11.8%)

  • Closings: 18 → 18 (flat)

  • Median price: $694,000 → $682,500 (–1.7%)

  • % of original list received: 99.0% → 98.7% (–0.3 pp)

  • DOM: 28 → 44 (+57.1%)

  • Inventory: 33 → 50 (+51.5%)

  • Months’ supply: 2.2 → 2.9 (+31.8%)

Year-to-Date (Jan–Aug)

  • New listings: 177 → 248 (+40.1%)

  • Pendings: 127 → 149 (+17.3%)

  • Closings: 125 → 132 (+5.6%)

  • Median price: $670,000 → $650,000 (–3.0%)

  • DOM: 26 → 41 (+57.7%)

Attached inventory expanded sharply, giving buyers more selection. Demand kept up enough to lift pendings, but marketing times lengthened and pricing softened a touch.


East Chula Vista EastLake Otay Ranch Windingwalk Rolling Hills Real Estate Market Report Fall 2025

91914 — Chula Vista NE (Rolling Hills Ranch & surrounds)

Single-Family (Detached)

August 2025 vs. August 2024

  • New listings: 9 → 9 (flat)

  • Pendings: 13 → 9 (–30.8%)

  • Closings: 11 → 8 (–27.3%)

  • Median price: $1,375,000 → $1,455,000 (+5.8%)

  • % of original list received: 96.9% → 97.4% (+0.5 pp)

  • DOM: 18 → 50 (+177.8%)

  • Inventory: 16 → 23 (+43.8%)

  • Months’ supply: 2.0 → 3.2 (+60.0%)

Year-to-Date (Jan–Aug)

  • New listings: 113 → 96 (–15.0%)

  • Pendings: 77 → 62 (–19.5%)

  • Closings: 69 → 57 (–17.4%)

  • Median price: $1,335,000 → $1,320,135 (–1.1%)

  • % of original list received: 99.7% → 97.6% (–2.1 pp)

  • DOM: 31 → 40 (+29.0%)

Fewer buyers and more selection pushed DOM up notably. Still, August’s median price rose ~6% year-over-year, showing that well-positioned homes at the higher end are finding their market. The move from ~2 to ~3.2 months’ supply suggests a shift toward a more balanced feel, but not a true buyer’s market.

Townhome/Condo (Attached)

August 2025 vs. August 2024

  • New listings: 5 → 2 (–60.0%)

  • Pendings: 3 → 3 (flat)

  • Closings: 5 → 7 (+40.0%)

  • Median price: $610,000 → $665,000 (+9.0%)

  • % of original list received: 102.9% → 98.8% (–4.0 pp)

  • DOM: 20 → 38 (+90.0%)

  • Inventory: 7 → 4 (–42.9%)

  • Months’ supply: 2.9 → 1.2 (–58.6%)

Year-to-Date (Jan–Aug)

  • New listings: 31 → 30 (–3.2%)

  • Pendings: 23 → 24 (+4.3%)

  • Closings: 22 → 20 (–9.1%)

  • Median price: $672,500 → $655,500 (–2.5%)

  • DOM: 20 → 40 (+100%

Very limited new supply in August tightened conditions, supporting a ~9% price gain month-over-year even as marketing times lengthened.


91915 — Chula Vista SE (Otay Ranch / Montecito)

Single-Family (Detached)

August 2025 vs. August 2024

  • New listings: 9 → 9 (flat)

  • Pendings: 8 → 14 (+75.0%)

  • Closings: 17 → 8 (–52.9%)

  • Median price: $975,000 → $959,606 (–1.6%)

  • % of original list received: 99.5% → 97.4% (–2.1 pp)

  • DOM: 33 → 39 (+18.2%)

  • Inventory: 17 → 20 (+17.6%)

  • Months’ supply: 1.8 → 1.9 (+5.6%)

Year-to-Date (Jan–Aug)

  • New listings: 109 → 129 (+18.3%)

  • Pendings: 83 → 89 (+7.2%)

  • Closings: 80 → 78 (–2.5%)

  • Median price: $965,250 → $918,750 (–4.8%)

  • DOM: 26 → 31 (+19.2%)

Demand improved in August (pendings up) with only a mild increase in supply. YTD median pricing has eased ~5%, suggesting buyers are price-sensitive and responding to homes that show value.

Townhome/Condo (Attached)

August 2025 vs. August 2024

  • New listings: 8 → 21 (+162.5%)

  • Pendings: 12 → 17 (+41.7%)

  • Closings: 20 → 17 (–15.0%)

  • Median price: $725,000 → $720,000 (–0.7%)

  • % of original list received: 99.7% → 100.0% (+0.3 pp)

  • DOM: 28 → 60 (+114.3%)

  • Inventory: 14 → 36 (+157.1%)

  • Months’ supply: 1.1 → 3.4 (+209.1%)

Year-to-Date (Jan–Aug)

  • New listings: 134 → 141 (+5.2%)

  • Pendings: 110 → 93 (–15.5%)

  • Closings: 108 → 86 (–20.4%)

  • Median price: $700,000 → $707,000 (+1.0%)

  • DOM: 32 → 48 (+50.0%

A surge of new attached listings expanded months’ supply to ~3.4, shifting leverage toward buyers and stretching DOM. Prices held roughly flat month-over-year and are slightly up ~1% YTD, indicating sellers can still achieve solid results with the right strategy.


What This Means for EastLake/Otay Ranch Sellers & Buyers

Sellers

  • Price to the market, not above it. In all three zips, buyers are rewarding homes that show value; the % of original list received has eased from pandemic highs, and DOM is longer in multiple segments.

  • Preparation and presentation matter. With months’ supply hovering ~2–3.5 in many slices, you’re competing with more options. Pre-market prep, strategic pricing, and full-funnel marketing are critical to protect days on market and negotiation power.

  • Detached strength in 91913. Despite August’s monthly price dip, YTD median is up ~5%. Good opportunity for move-up sellers who can pair a strong sale with negotiating power on the buy side.

Buyers

  • More choice, more time (especially attached). 91913 attached and 91915 attached saw sizeable inventory growth and higher months’ supply. This creates room to negotiate on terms, credits, and repairs.

  • Watch micromarkets. 91914 detached had slower absorption but higher August median; premium, turnkey homes can still command strong outcomes even as overall DOM rises.

  • Leverage DOM trends. When DOM stretches beyond ~30–40 days, consider targeted offers with appraisal/repair credits instead of straight price cuts, depending on seller priorities.


Quick Zip-by-Zip Takeaways

  • 91913 (EastLake)

    • Detached: Demand rebounded in August; YTD prices +4.9% with modestly higher inventory.

    • Attached: Big supply increase; DOM up; prices –3.0% YTD → better negotiating window. 

  • 91914 (NE Chula Vista / Rolling Hills Ranch)

    • Detached: Buyers are pickier; DOM up; August median +5.8% shows quality still wins.

    • Attached: Low August supply lifted prices +9% YoY; but YTD price slightly lower and DOM higher.

  • 91915 (SE Chula Vista / Otay Ranch–Montecito)

    • Detached: Activity improving, pricing slightly softer YTD; strategy over sizzle.

    • Attached: Inventory surge → 3.4 months’ supply and much longer DOM; buyers have leverage.


Bottom Line

This part of East Chula Vista is transitioning from the ultra-tight, over-asking era to a more balanced, strategy-driven market. Inventory is no longer scarce in several segments, and days on market are normalizing. If you’re selling, price right and present flawlessly. If you’re buying, use the added selection and time to secure favorable terms—especially in the attached segments.


Prepared with MLS data current as of Sept 5, 2025 (Greater San Diego Association of REALTORS® / ShowingTime Plus).

Sept. 8, 2025

San Diego County Real Estate Market Report Fall 2025

San Diego County Real Estate Market Report Fall 2025

Median Price Increases, Inventory Up, Taking Longer to Sell Homes

The San Diego housing market in August 2025 reflects a mixed performance characterized by rising prices, slower sales activity, and increasing inventory. While demand remains solid, affordability challenges and longer time on market suggest buyers are becoming more selective.


San Diego County Real Estate Market Report Fall 2025

Key Market Indicators

Sales Activity

  • Closed Sales:

    • Detached homes: 1,291, down 5.2% year-over-year.

    • Attached homes (condos/townhomes): 655, down 18.3% year-over-year.

    • Overall, sales declined 10.1% across the county

  • Pending Sales:

    • Detached: +2.6% (1,358 contracts).

    • Attached: +1.1% (706 contracts).

    • Indicates some future stability despite recent sales declines.


Pricing Trends

  • Median Sales Price:

    • Detached homes: $1,075,000, up 2.4% YoY.

    • Attached homes: $675,000, down 0.1% YoY.

    • Overall county median: $915,000, up 3.4% YoY.

  • Average Sales Price:

    • Detached: $1,458,287, up 5.1% YoY.

    • Attached: $823,810, up 4.1% YoY.

    • Overall average: $1,244,943, up 6.7% YoY.

📌 Takeaway: Detached homes continue appreciating, while attached housing prices are leveling off.


San Diego County Real Estate Market Report Fall 2025

Inventory & Supply

  • Inventory of Homes for Sale:

    • Detached: 3,512 (up 8.4% YoY).

    • Attached: 2,573 (up 25.7% YoY).

    • Total: 6,085 homes, a 15.1% increase

  • Months Supply of Inventory (MSI):

    • Detached: 2.8 months (+3.7% YoY).

    • Attached: 3.8 months (+26.7% YoY).

    • Total market: 3.2 months, up 14.3%

📌 Takeaway: The market is gradually shifting toward balance, especially for condos and townhomes where inventory has surged.


Market Speed & Competition

  • Days on Market (DOM):

    • Detached: 39 days, up 39.3% YoY.

    • Attached: 42 days, up 27.3% YoY.

    • Total: 40 days, up 33.3%

  • Percent of Original List Price Received:

    • Detached: 96.5% (-2.2% YoY).

    • Attached: 97.0% (-1.0% YoY).

    • Buyers are negotiating more, and bidding wars are less common

📌 Takeaway: Homes are staying longer on the market and selling below list price more often.


Affordability

  • Housing Affordability Index (HAI):

    • Detached: 26 (-3.7% YoY).

    • Attached: 41 (flat YoY).

    • Overall: 30 (-6.3% YoY).

📌 Takeaway: Affordability remains one of the greatest challenges in San Diego, with detached homes particularly out of reach for many buyers.


Year-to-Date (YTD) Trends (Jan–Aug 2025)

  • Closed Sales: 15,181 (-4.1% YoY).

  • Pending Sales: 15,998 (-2.0% YoY).

  • New Listings: 27,244 (+11.6% YoY).

  • Dollar Volume of Sales: $18.26 billion (-3.0% YoY).

  • Median Price (All Properties): $906,000 (+0.7% YoY).

  • Average Price (All Properties): $1.19M (+1.2% YoY).


Market Outlook

  1. Inventory Growth – Buyers have more options, particularly in the attached market, which could put pressure on condo/townhome pricing.

  2. Stabilizing Prices – Detached homes are still appreciating modestly, but overall price growth is slowing compared to the double-digit gains of prior years.

  3. Slower Sales Pace – Higher DOM and reduced list-to-sale ratios indicate buyers are cautious and waiting for value.

  4. Affordability Issues – With HAI near historic lows, demand could continue to soften unless interest rates decline.


Conclusion

The San Diego housing market in August 2025 is showing early signs of cooling after years of strong growth. Prices for single-family homes remain resilient, but sales activity is slowing, inventory is climbing, and affordability is strained. Buyers now have more leverage in negotiations, especially in the attached housing sector, while sellers must price strategically to attract offers.

San Diego Real Estate

Sept. 2, 2025

Carlsbad Single-Family Market July 2025

Carlsbad Single-Family Market — July 2025 

Carlsbad San Diego Real Estate Market in Transition

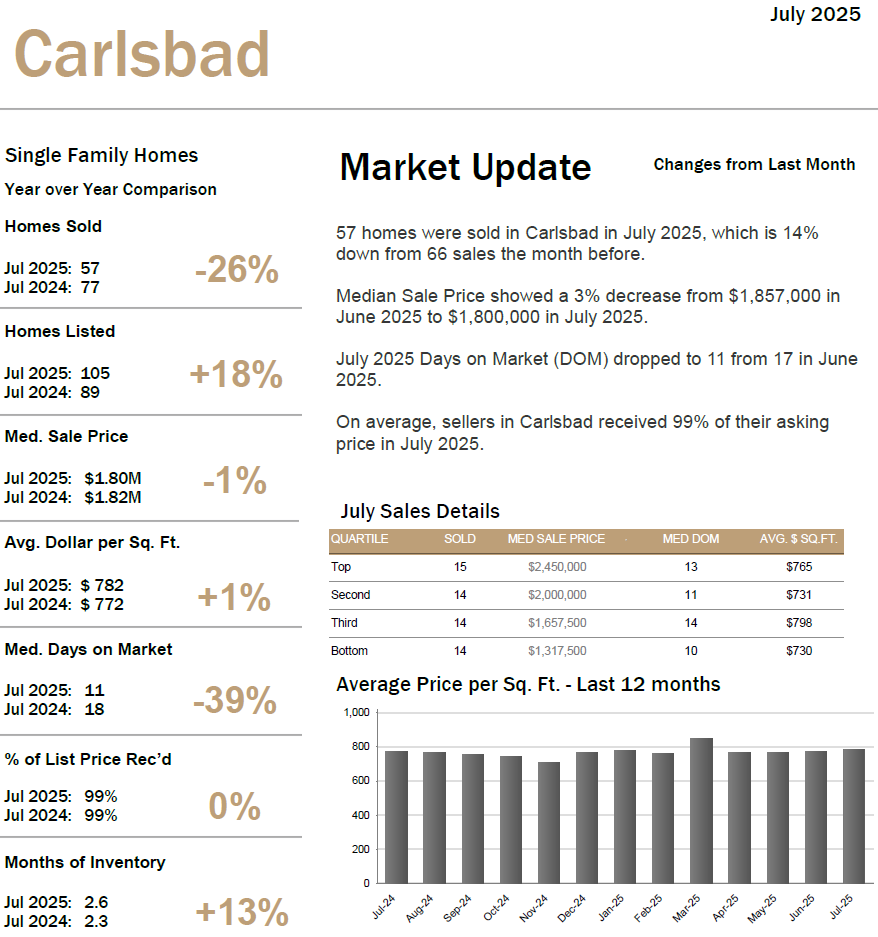
Carlsbad’s single-family market cooled in July on price and closings, but moved faster and with slightly more selection than a year ago. Buyers are getting a touch more negotiating room than in spring, yet sellers still command near-list results when homes are priced right.


Quick takeaways

  • 57 homes closed in July (down from 66 in June; –26% YoY vs. 77 in July 2024).

  • Median price: $1.80M (–3% MoM from $1.857M; –1% YoY vs. $1.82M).

  • Days on market: 11 (down from 17 in June and 18 a year ago). Homes are moving quicker.

  • Sale-to-list: 99%—minimal discounting on average.

  • New listings: 105 (up from 98 in June and +18% YoY vs. 89). Supply is improving.

  • Avg. $/sf: $782 (+1% YoY; $772 a year ago). 

  • Months of inventory: 2.6 (vs. 2.3 a year ago), still a lean sellers’ market but trending toward balance.

Carlsbad Real Estate July 2025 Statistics

Month-over-month vs. year-over-year: what changed?

Sales volume: July closings fell to 57 from 66 in June (–14% MoM) and 77 last July (–26% YoY). That’s a meaningful step down in demand compared with early summer. For buyers, fewer bidding skirmishes; for sellers, expect normal market times if you price with the comps.

Prices: The median slid to $1.80M, off 3% from June’s $1.857M and 1% lower than a year ago. This is a reversion from spring’s peak rather than a structural break—think seasonal cooling plus more price-sensitive buyers.

Speed: Median DOM plunged to 11 days (from 17 in June, 18 last year). Well-prepared listings still find buyers quickly; the slower part of the market is largely over-priced or under-prepared inventory.

Negotiation: The average sale landed at 99% of list—essentially flat to last month and last year—which underscores that pricing strategy matters more than ever (slightly under list to drive traffic vs. over-reaching and sitting).

Supply: 105 new listings hit the market (up from 98 in June and +18% YoY vs. 89). With 2.6 months of inventory vs. 2.3 a year back, shoppers have a bit more choice, but we’re still below the 4–6 months that typically signals a truly balanced market.

Where the price action happened (by quartile)

July’s sales spread shows different dynamics across price tiers:

  • Top quartile: $2,450,000 median; 15 DOM; $765/sf

  • Second quartile: $2,000,000; 14 DOM; $731/sf

  • Third quartile: $1,657,500; 14 DOM; $798/sf

  • Bottom quartile: $1,317,500; 10 DOM; $730/sf

Two insights jump out:

  1. The third quartile’s $/sf ($798) is the highest—often mid-sized, renovated homes in hot micro-neighborhoods command the strongest per-foot premiums.

  2. The bottom quartile moved the fastest (10 DOM)—good entry-level or downsizer-friendly homes are getting scooped quickly when priced on the nose.

Price per square foot & list-to-sale ratio

Twelve-month trends show $/sf grinding higher (+1% YoY to $782), while the sale-to-list ratio has hovered around 99%—a signal that Carlsbad’s market rewards correct pricing and turnkey presentation even as headline median prices drift month to month. 

What this means if you’re buying

  • You have options: New listings up 18% YoY and inventory at 2.6 months means more choice than last summer—use it to compare condition, location, and concessions.

  • Move fast on the right home: With 11-day median DOM, clean, well-priced listings are still moving quickly. Get underwriting ready and negotiate on specifics (repairs/credits) rather than chasing list price cuts that may not materialize on turn-key homes. 

  • Value sweet spots: The bottom and third quartiles show strong activity—aim for mid-sized, renovated homes or sharpen your search for entry-level properties that are priced to sell. 

What this means if you’re selling

  • Price strategically: July’s –3% MoM median dip doesn’t mean slash; it means align to current comps and let the market work. Correctly priced listings still achieve ~99% of list.

  • Win the first two weeks: With 11-day median DOM, your launch (photos, staging, minor pre-list repairs) is the difference between strong traffic and slow weeks. 

  • Leverage momentum: If showings and offers spike early, negotiate toward your target terms (rent-back, shorter contingency windows) rather than simply top-line price—buyers are still paying near list when the home shows best. 

The bottom line

Carlsbad single-family stayed seller-leaning in July—fast market times and near-list results—yet buyers gained ground on choice (new listings +18% YoY, inventory up to 2.6 months) and small price givebacks. Expect late-summer and early-fall to reward accurate pricing and move-in-ready listings, while buyers should stay nimble and negotiate on condition and credits rather than waiting for deep list cuts that the data doesn’t support.

Data from MLSListings; reported as of 8/13/2025. Figures reference single-family homes within Carlsbad (San Diego County)

Call The Lewis Team today for more information about Carlsbad Real Estate and North County Coastal San Diego Real Estate.

San Diego Real Estate

Sept. 1, 2025

San Diego’s Lender-Mediated Housing Market — July 2025

San Diego’s Lender-Mediated Housing Market — July 2025 

Foreclosures, short sales, probate & court-approved listings 

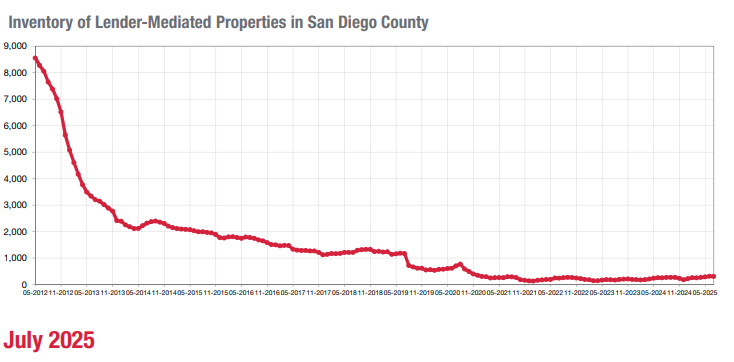
Foreclosures, short sales, probate & court-approved listings are creeping back—still a small slice of the market, but growing in a few pockets. Here’s what’s changing, why it matters, and how to play it.

What counts as “lender-mediated”? In the San Diego MLS this includes statuses like REO (bank-owned), short sale/short-sale prep, Notice of Default filed, HUD, HAP, probate/overbid, court approval required, certain deed-restricted or estate sales, and related flags. Residential only. (Data current as of Aug 5, 2025; GSDBR/SDAR MLS.) 


REO Foreclosures Short Sales in San Diego July 2025

Three fast headlines

  1. New lender-mediated listings jumped 18.1% year over year to 163 in July, lifting their share of all new listings from 4.3% → 4.9%.

  2. Closed sales overall fell 10.2% (marketwide demand cooled), but the lender-mediated slice only dipped 4.7% to 101, nudging their share of closings from 4.8% → 5.1%.

  3. Prices diverged: the overall median in July edged up 0.2% to $916,500; traditional sales rose 0.1% to $920,000; lender-mediated medians slipped 0.3% to $865,000


Supply snapshot: rising—especially in condos/townhomes

  • Active inventory (all property types): +28.7% YoY to 6,485.

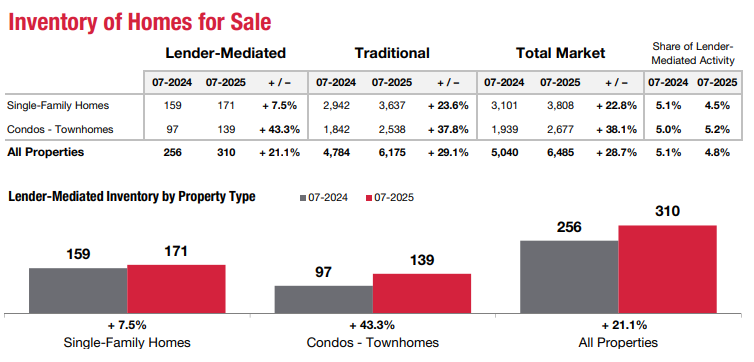
  • Lender-mediated inventory: +21.1% to 310 countywide.

    • Single-family homes: 171 (+7.5% YoY).

    • Condos/townhomes: 139 (+43.3% YoY).

  • Lender-mediated share of inventory: roughly steady overall (4.8%), but down in single-family (5.1% → 4.5%) and up in condos (5.0% → 5.2%). 

By price band (inventory):

  • ≤$250K: tiny segment, but the lender-mediated share jumped from 5.9% → 17.6% (3 such listings).

  • $500K–$750K: lender-mediated share 6.1% (up from 6.5% last year for traditional?—total share reflected at 6.1%), with counts rising from 60 → 78.

  • $750K–$1M: share 5.4% (lender-mediated units 144 → 186).

  • $1.0M–$1.25M: share fell to 2.9% (units 23 → 22).

  • $1.25M+: share 4.5% (units 89 → 102).
    Bottom line: most of the growth is sub-$1M and in attached product. 


REO Foreclosures Short Sales in San Diego July 2025 up by 21

Pricing & speed: “distressed” ≠ “cheap,” but dynamics differ

Single-family homes (July medians):

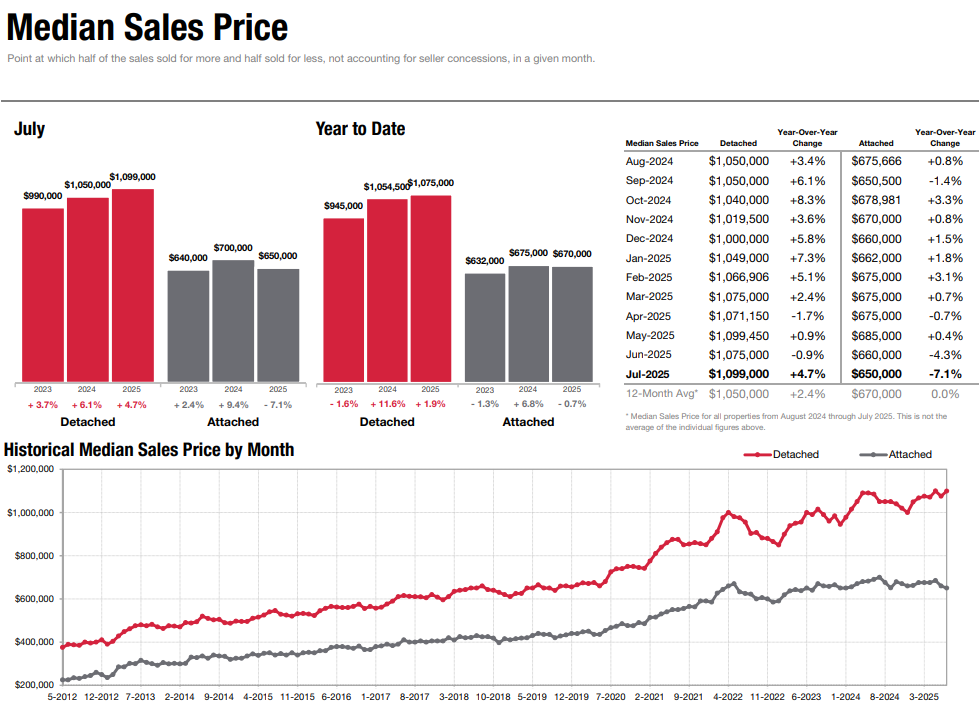
  • Lender-mediated: $975,000 (+2.4% YoY)

  • Traditional: $1,100,000 (+4.3%)

  • Total market: $1,099,000 (+4.7%)

Condos/townhomes (July medians):

  • Lender-mediated: $611,500 (–6.9% YoY)

  • Traditional: $651,000 (–7.0%)

  • Total market: $650,000 (–7.1%

Days on Market (DOM):

  • Lender-mediated SFR sold faster YoY (32 → 24, –25%), even as traditional SFR slowed (28 → 36, +28.6%).

  • Condos slowed across the board, with lender-mediated at 48 days (+26.3%) and traditional at 42 (+40%).

  • All properties: lender-mediated nearly flat (34 → 33), total market slower (29 → 38). Translation: the “opportunity” pool isn’t languishing if it’s financeable and priced right—especially detached homes. 


Geography: where lender-mediated shows up most

Higher current share of inventory (July 2025):

  • Coronado (92118): 10.6%, University City (92122): 8.8%, Ocean Beach (92107): 3.8% inventory but 11.6% share of closed sales over the past year—a sign these listings do move.

  • East & South urban submarkets post elevated lender-mediated shares of closed sales: Encanto (92114) 9.4%, City Heights (92105) 8.6%, San Ysidro (92173) 8.5%, National City (91950) 8.5%.

  • North County pockets: Julian (92036) 9.8% closed share, Rancho Santa Fe (92091) 9.3% (closed share), Oceanside North (92057) 6.9% inventory, 4.4% closed. (Always check sample sizes.) 

Median price swings by area (lender-mediated vs traditional, rolling 12 months):

  • Big LM gains (small sample volatility): Del Mar (92014) +61.4%, Ocean Beach (92107) +84.8%, Penasquitos (92129) +44.0%, Rancho Santa Fe (92067) +27.1%, Coronado (92118) +15.1%.

  • LM declines: Pacific Beach/Mission Beach (92109) –30.5%, Morena (92110) –? / traditional –6.6%, La Jolla (92037) –4.2% (LM) even as traditional +10.3%.
    Interpretation: area-level LM medians swing more because counts are thin; read them as directional and always confirm with property-level comps. 


What this means for buyers

  1. There’s more choice—and more paperwork. Lender-mediated inventory is up, especially condos/townhomes. Expect addenda, court or lender timelines, and as-is clauses. Build in inspection strategy and repair/credit asks that reflect property condition.

  2. Detached LM deals can move quickly. With DOM down to 24 days for LM SFR, be pre-approved, understand the approval path (REO vs probate vs short sale), and write clean terms without sacrificing the right contingencies.

  3. Use area data to target. If you’re price-sensitive, scan zip codes where LM share of closed sales is higher (e.g., 92107, 92114, 92105, 91950)—that’s a tell that deals actually finish. 


What this means for sellers

  1. Competing against “value” listings. Even though LM is only ~5% of activity, it frames buyer expectations. Prep and price traditionally listed homes so they stand out on condition and certainty (clear disclosures, repairs done).

  2. Condos face the most supply pressure. If you’re listing an attached home, budget for longer DOM and consider seller credits (rate buydowns/HOA-related fixes) to widen the buyer pool.

  3. Micro-market rules. LM medians in places like Ocean Beach, Coronado, Rancho Santa Fe saw big swings—mostly due to small sample sizes. Don’t anchor to headline gains; we’ll run a street-level CMA


Investor angle

  • Pipeline is rising, not surging. LM new listings at 4.9% of supply and 5.1% of closings aren’t 2009-style levels, but the condo wave (+43% YoY inventory) merits a watchlist. Underwrite HOA health, special assessments, and rental caps.

  • Velocity matters. LM SFRs’ faster DOM suggests financeable, livable assets are clearing. Target probate “subject to overbid” and clean REOs; be more selective with short sales (timeline risk). 


The bottom line

San Diego’s lender-mediated segment is still small (~5%) but growing in a few segments, notably condos/townhomes and specific zip codes. Price behavior is nuanced: detached LM homes can trade briskly and near market; attached shows more softness and time. If you’re shopping for opportunity—or guarding your equity—micro-market comps and the specific disposition path (REO, probate, short sale, court approval) will make or break outcomes. 

What is Lender Mediated?

A lender-mediated sale is a real estate transaction involving a property where the lender plays an active and cooperative role in the sale due to the homeowner's financial distress. The term broadly covers several alternatives to a traditional foreclosure, with the most common being a short sale.
Types of lender-mediated sales
  • Short Sale: The most common form of lender-mediated sale. The lender allows the homeowner to sell the property for a price that is less than the outstanding mortgage balance. The lender must approve the sale and the terms, and will typically either forgive the remaining debt or pursue a deficiency judgment for the unpaid balance.
  • Deed in lieu of foreclosure: With this option, the homeowner voluntarily signs the deed over to the lender to be released from their mortgage obligation. It avoids the court process of a foreclosure, but lenders usually prefer a short sale as it avoids the lender having to manage and sell the property.
  • Foreclosure mediation: In states or counties where it is offered, a neutral third-party mediator helps a homeowner and lender negotiate a way to avoid foreclosure. The outcome could be a loan modification, a payment plan, or a consensual sale.
  • Real Estate Owned (REO): This occurs when a property fails to sell at a foreclosure auction and the lender takes possession of it. In this case, the lender is the seller and lists the property through a real estate agent to recover its investment. 
Why lenders mediate a sale
Lenders often prefer mediating a sale over pursuing a foreclosure because it can be a quicker and less costly resolution for all parties involved. It allows the lender to avoid the legal fees, property maintenance costs, and risks associated with foreclosures. For homeowners, a mediated sale can be less damaging to their credit than a foreclosure. 
Need help with a short sale or foreclosure?
Call The Lewis Team today - We're San Diego's Real Estate Team!
San Diego Real Estate
Aug. 31, 2025

San Diego Real Estate Rebalancing Summer 2025

San Diego Real Estate Rebalancing Summer 2025

San Diego is moving toward a more balanced market

The July 2025 housing market numbers for San Diego County highlight a market in transition, with diverging trends between detached (single-family) homes and attached properties (condos/townhomes). While detached homes held steady with price growth despite slower sales, attached homes saw price declines, longer market times, and swelling inventory. Here’s a full breakdown of what the data reveals and what it means for buyers and sellers. 


📊 Market Overview

  • Closed Sales (All Properties): Down 10.2% year-over-year.

  • Median Sales Price (All Properties): Essentially flat, up just 0.2% to $916,500.

  • Inventory: Total homes for sale surged 28.7% compared to July 2024.

  • Months of Supply: Climbed to 3.4 months, a 25.9% increase, signaling more balance between buyers and sellers.

  • Days on Market: Homes now take an average of 38 days to sell, up from 29 days last year.

  • Percent of Original Price Received: Dropped to 97.4%, indicating more negotiation room for buyers. 


🏡 Detached Homes (Single-Family)

Detached homes remained relatively resilient, with prices up but buyer activity slowing.

  • Median Sales Price: Rose 4.7% year-over-year to $1,099,000.

  • Average Sales Price: Up 1.8% to $1,417,843.

  • Closed Sales: Fell 10.0% to 1,303 transactions.

  • Pending Sales: Inched up 2.2%, suggesting some stabilization in demand.

  • Inventory: Rose 22.8% to 3,808 active listings.

  • Months of Supply: Increased to 3.1 months (up 19.2%).

  • Days on Market: Jumped from 28 days → 36 days (+28.6%).

  • Percent of Original Price Received: Down from 99.0% → 97.4%

Takeaway: Single-family homes continue to hold their value, but the market is slowing. Sellers can still achieve strong prices if they price strategically, but buyers now have more leverage than in recent years.


Median Sales Price San Diego Homes and Condos 2025 Summer

🏢 Attached Homes (Condos & Townhomes)

The attached market softened more noticeably, with prices and sales both declining.

  • Median Sales Price: Dropped 7.1% to $650,000.

  • Average Sales Price: Down 3.4% to $800,489.

  • Closed Sales: Fell 10.7% year-over-year to 676 units.

  • Pending Sales: Down 5.0% to 744 contracts signed.

  • Inventory: Surged 38.1% to 2,677 active listings.

  • Months of Supply: Climbed to 4.0 months (up 37.9%).

  • Days on Market: Extended from 30 days → 42 days (+40%).

  • Percent of Original Price Received: Fell to 97.3%

Takeaway: The condo/townhome segment is shifting toward a buyer’s market, with more selection, slower absorption, and declining prices.


💰 Sales Volume & Market Dynamics

  • Dollar Volume of Sales: Down sharply, with detached sales volume at $1.78B (-11.7%) and attached at $524M (-16.6%).

  • Overall Market Dollar Volume: Fell 12.9% year-over-year. 

This illustrates not just fewer sales, but also that buyers are negotiating harder and sellers are adjusting expectations.


🏠 Housing Affordability

  • Detached Homes: Affordability index slipped to 25, down 3.8% from last year.

  • Attached Homes: Improved slightly to 42, up 7.7%, thanks to lower price points.


🔑 What This Means for Buyers & Sellers

For Sellers

  • Detached homeowners can still secure strong pricing but must price competitively to avoid extended market times.

  • Condo sellers should prepare for longer negotiations and possibly offer incentives such as rate buydowns or repair credits.

For Buyers

  • Buyers now have more leverage with longer market times and more listings to choose from.

  • The condo market in particular offers opportunities to negotiate below list price.

  • Detached home buyers should still expect competition for move-in ready homes in desirable neighborhoods, but bidding wars have eased.


📌 The Bottom Line

The San Diego housing market in July 2025 reflects a cooling trend, with detached homes maintaining value but selling slower, while condos/townhomes soften under rising supply. Buyers are gaining ground, and sellers must adjust expectations compared to the red-hot market of the past few years.

San Diego is moving toward a more balanced market—good news for buyers who have been waiting for more opportunities, and a reminder to sellers that pricing and presentation matter more than ever.

San Diego Real Estate